This post talks about the initial release, which is outdated. You should check README for latest usage instruction. Most parts are still valid though despite the HLTB data structure change.
Introduction
It’s been a while since I posted Install Fee Tycoon, Explained back in October. I was really busy this month, so had no time to write posts. In case you have questions about the title, HLTB stands for HowLongToBeat, which is also an acronym for HowLongToBeat Linear and Temporal Breakdown. Excuse my bad sense of humor.
HowLongToBeat is a website that helps your track play times, which is also in collaboration with Microsoft to show approximate competition time for the Xbox app on PC. The best thing is you can export your records to a CSV file so you really own your data, instead of relying on some unsecure third party.
This is a linear and temporal data analysis & visualization based on the exported CSV using Python libraries, notably numpy, pandas and matplotlib, you know, the data engineering troika.
Explanation
It’s not a single Python script, but a set of scripts served for different purposes. They can, of course, be improved/merged, if needed.
There are three scripts, I will explain them one by one:
| Script | Function |
|---|---|
HLTB-Sanitizer.py | Sanitize exported data |
HLTB-Analyzer.py | Analyze sanitized data |
HLTB-Visualizer.py | Generate a few ugly charts from sanitized data |
HLTB-Barchartrace.py | Patch CSV to meet the criteria of batchartrace |
Sanitizer
If I recall correctly, I wrote a few suggestions to HowLongToBeat website and have received no replies yet but whatever. HLTB staff finally replied with multiple changes after 4 months of waiting (better late than never), so following parts may contain information no longer valid. You are suggested to check the repo for up-to-date codes.
Problem one: custom tag column.
This is fairly tricky, maybe they just export the database query as is and do not do any sanitization. So you would have CSV like this:
"Title","Platform","Playing","Backlog","Replay","Stalled","Blocked","","Completed","Retired","Completed","Progress","Main Story","Main Story Notes","Main + Extras","Main + Extras Notes","Completionist","Completionist Notes","Speed Any%","Speed Any% Notes","Speed 100%","Speed 100% Notes","Co-Op","Multi-Player","General Notes","Storefront","Review","Review Notes","Added","Updated"

"Fate/Samurai Remnant","Nintendo Switch","","","","","","","✓","","2023-10-05","34:28:00","--","","23:44:00","Flames of Resentment & joke ending. Lunar Chronicle 74%, Digressions 65%.","34:28:00","All endings & most quests completed. Lunar Chronicle 99%, Digressions 94%.","--","","--","","--","--","","Nintendo eShop","80","","2023-09-28 14:28:01","2023-10-05 12:30:06"
Can’t see anything wrong? Check that column between Blocked and Completed, it’s empty! I spent almost half an hour to find out this😿 HowLongToBeat allows you to set three custom lists at most, which is great. But as I only use two of them (Stalled & Blocked), the third one is blank and would cause trouble later on. Let’s just remove it:
# Omit many lines of code
# Load dataframe
df = pd.read_csv(filepath)

# Drop unused custom tag column index between "Blocked" and "Completed"
blocked_index = df.columns.get_loc("Blocked")
# completed_index = df.columns.get_loc("Completed")
middle_column_index = blocked_index + 1
df.drop(df.columns[middle_column_index], axis=1, inplace=True)
Similarly, rename the confusing Completed columns. The first one stands for game status while the latter means completed date.
# Rename second "Completed" column (the one before "Progress") to "Completed Date"
progress_index = df.columns.get_loc("Progress")
columns = df.columns.tolist()
columns[progress_index - 1] = "Completed Date"
df.columns = columns
Also, HLTB allows you to tag a game without providing play time, in which case would export the data as -- instead of null, replace that with NaN in numpy:
# Replace "--" (implying null time) with NaN
df.replace("--", np.nan, inplace=True)
And finally, remove blocked games since I tag them solely to hide them in HLTB searching results:
# Exclude blocked games
df = df[df["Blocked"] != "✓"]
Let’s just stop here, check script comments for details.
Analyzer
When I break into Data Science, I only know about three lines of code (just kidding):
import matplotlib.pyplot as plt
import pandas as pd
import numpy as np
Probably one more line:
import seaborn as sns
Jokes aside, month_playtime is calculated based on hard-coded month start/end, you should manually change that if desired.
Visualizer
I did try to use plotly this time, but failed with no luck due to its browser nature as I prefer a static image. While plotly supports generating offline image, it requires imageio or Pillow (PIL) and I have difficulty saving the GIF. So just keep it simple, stupid. You know, the KISS principle.
HLTB does quite a lot visualization already and I can’t think up many other ways due to my limited imagination. As a result, I just included two charts in HLTB-Visualizer.py.
Here is what it would look like:
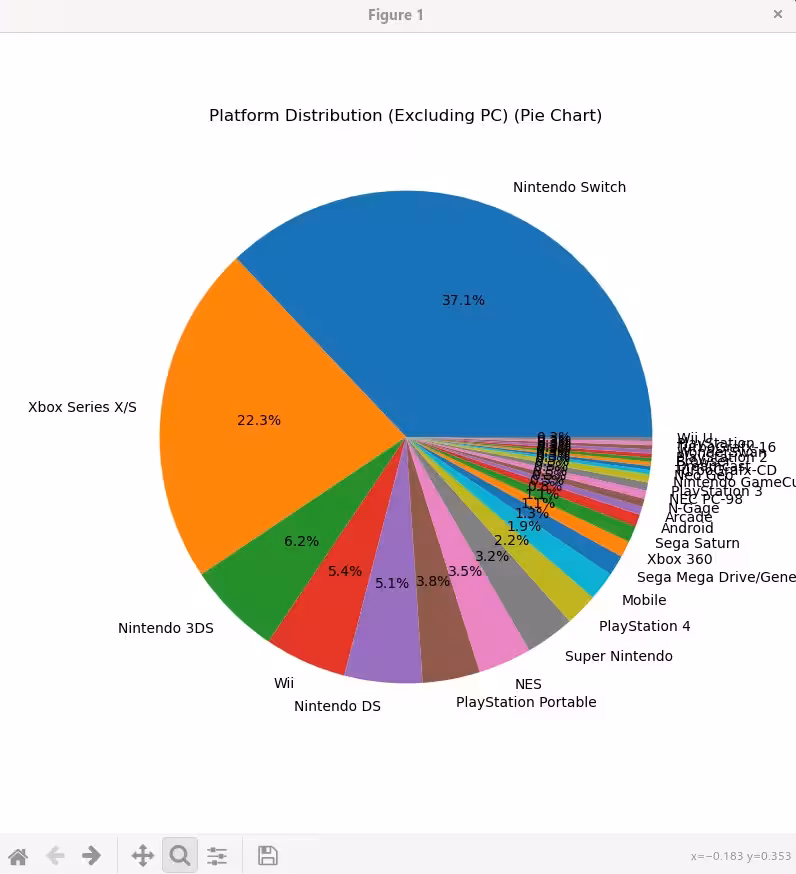
It doesn’t look good on the right side but you can zoom in a bit:
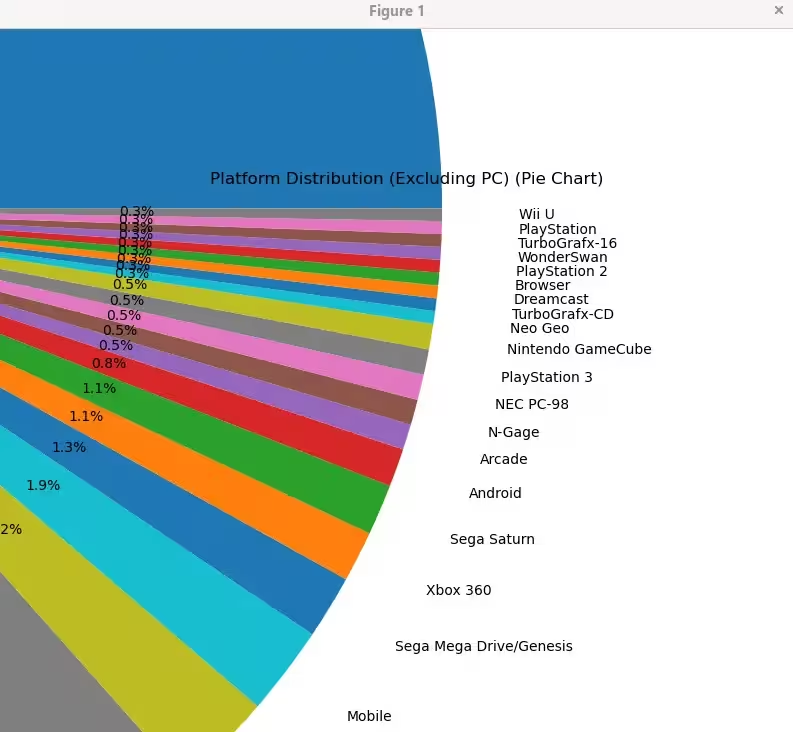
It’s still ugly, I know, that’s exactly why I write HLTB-Barchartrace.py.
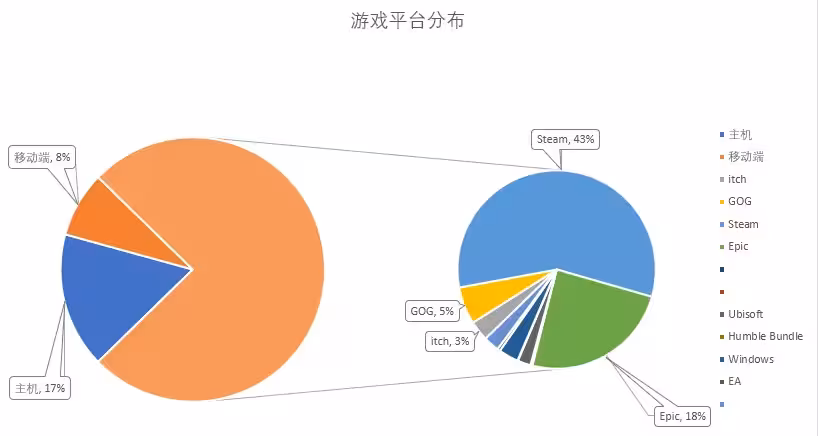
BTW, the charts in my gaming ledger are far better, but they are done in a smaller basis and would change dynamically, thus lacking the ability to handle massive (static) data like these Python libraries. Here is what one of the charts looks like as of writing (some platforms are redacted for privacy):
There is also a function to generate review wordcloud, a bit pointless since I hardly write reviews on HLTB.
Bar Chart Race
This script patches CSV to meet the criteria of batchartrace. If you worry about the data being leaked, you can just clone the repository and use it locally. It would still require Internet to fetch resources though.
The difficult part is that BarChartRace only supports these two formats:
Option 1: one row per date (ordered) and one column per contender.
| Date | Name1 | Name2 |
|---|---|---|
| 2018-01-01 | 1 | 1 |
| 2018-02-01 | 2 | 3 |
| 2018-03-01 | 4 | 7 |
Option 2: one row per contender and per date (row order doesn’t matter)
| Date | Name | Value |
|---|---|---|
| 2018-01-01 | Name1 | 1 |
| 2018-01-01 | Name2 | 3 |
| 2018-02-01 | Name1 | 2 |
| 2018-02-01 | Name2 | 3 |
| 2018-03-01 | Name1 | 4 |
| 2018-03-01 | Name2 | 7 |
The sanitized CSV file certainly does not meet the requirement, I have to find all unique Date and Platform/Storefront combinations, fill in the blank parts to fix the wrecked data structure. Anyway I get it done through trial and error.
As for the results, let me just show you the video:
For illustration purpose only, this is NOT 100% accurate on my gaming history last year. I only started using HLTB in August 2022 so there is much unavoidable noise in the data.
I replace the platform/storefront names with simplified aliases due to readability issue in the generated chart. Just edit the replacement dictionary if it contains any confusing name to you.
You can also filter out a specific day or date range, by default it’s disabled:
# Filter out rows where 'Date' is earlier than '2022-10-01'
df_sorted = df_sorted[df_sorted['Date'] >= '2022-10-01']

# Filter out rows where 'Date' is later than '2022-10-31'
df_sorted = df_sorted[df_sorted['Date'] <= '2022-10-31']
Also, you can change the division between Platform and Storefront.
Conclusion
You can find the scripts at Vinfall/hltb.
Visualization per se is no problem to me, but I find it really hard to think up a way to visualize the data. It requires inspiration and innovative state of mind. That’s also how I feel when writing my undergraduate thesis. I’m convinced to be one of the top undergraduates (and even among postgraduates) in terms of subject theories and all sorts of tools, and I’m confident my topic is really unique (Shiji,1 that is), but the thesis ended up being mediocre as I have no idea about how to conclude it. It’s more like I come, I see, I quit than VENI VIDI VICI.
I have a vacant/discontinued series on this too, for details check 评『史记 游侠列传』. ↩︎